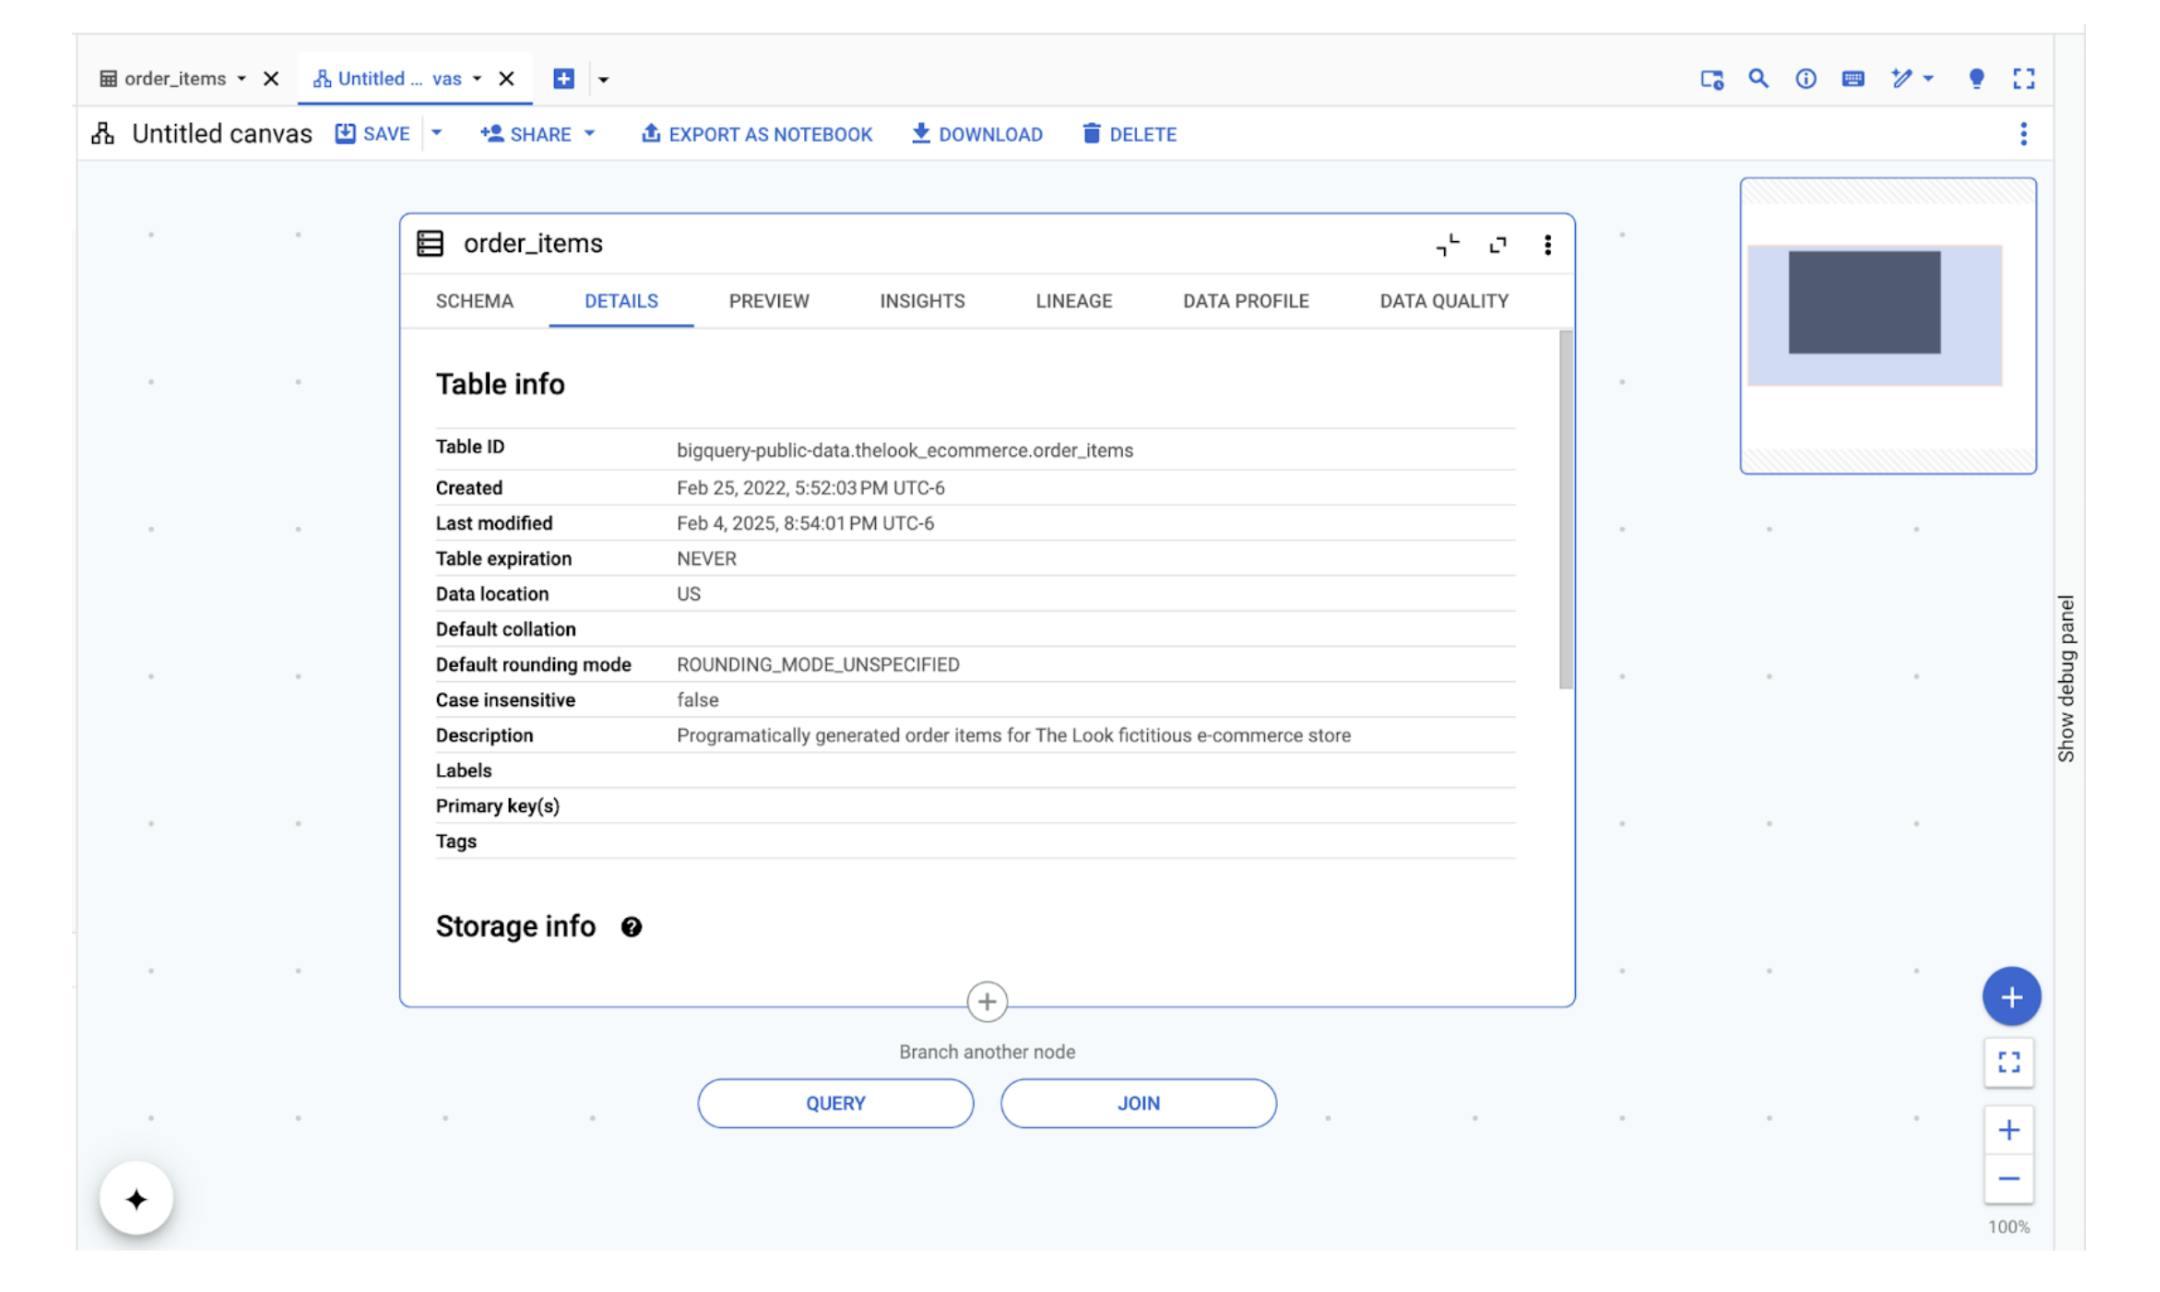
"BigQuery Data Canvas provides a visual environment allowing users to interact with data without writing complex SQL queries, utilizing drag-and-drop features for analysis."
"Data Canvas simplifies data exploration by enabling users to create visualizations through intuitive actions, while also allowing them to generate SQL queries with natural language."
"Business users can perform data analysis independently with Data Canvas, preventing the need for extensive SQL knowledge and fostering a culture of data democratization."
"The platform presents data in a way that allows users to effortlessly visualize relationships and make meaningful insights from raw data."
Data Canvas is a visual tool that revolutionizes data analysis by enabling users to explore, query, and visualize data without needing SQL. It features a drag-and-drop interface and Natural Language Processing through Gemini, allowing users to generate SQL queries simply by asking questions. This tool empowers business users to conduct their own analyses, increasing productivity and democratizing data access across organizations. It visualizes data relationships, aiding in the translation of raw data into insightful narratives, thus bridging the gap between data and actionable insights.
Read at Hackernoon
Unable to calculate read time
Collection
[
|
...
]