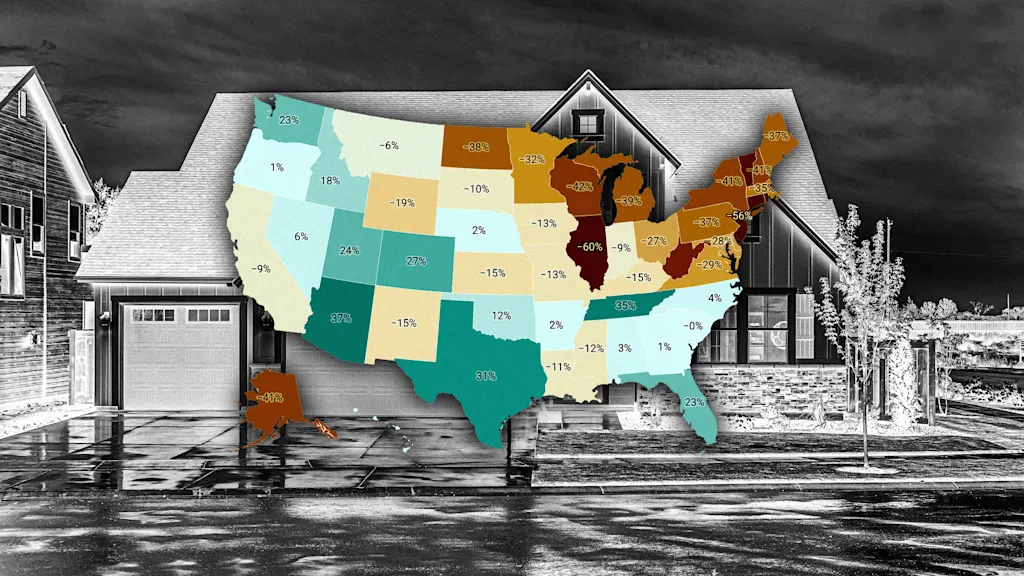
"Since the national Pandemic Housing Boom fizzled out in 2022, the national power dynamic has slowly been shifting directionally from sellers to buyers. Of course, across the country that shift has varied significantly. Generally speaking, local housing markets where active inventory has jumped above pre-pandemic 2019 levels have experienced softer home price growth (or outright price declines) over the past 36 months. Conversely, local housing markets where active inventory remains far below pre-pandemic 2019 levels have, generally speaking, experienced more resilient home price growth over the past 36 months."
"National active listings are on the rise on a year-over-year basis (+15% from October 2024 to October 2025). This indicates that homebuyers have gained some leverage in many parts of the country over the past year. Some seller's markets have turned into balanced markets, and more balanced markets have turned into buyer's markets. Nationally, we're still below pre-pandemic 2019 inventory levels (9% below October 2019) and some resale markets, in particular chunks of the Midwest and Northeast, still remain tight-ish."
Active listings and months of supply are essential indicators for assessing home price momentum. Rapid increases in active listings combined with longer market times may signal pricing softness or weakness. Rapid declines in active listings may indicate a market heating up. Since the pandemic boom ended in 2022, the national balance of power has gradually shifted from sellers toward buyers, with substantial regional variation. Markets with active inventory above pre-pandemic 2019 levels have generally seen softer or declining prices over 36 months. Markets remaining well below 2019 inventory levels have generally experienced more resilient price growth.
Read at Fast Company
Unable to calculate read time
Collection
[
|
...
]